You are putting all your eggs in one basket If you aren’t segmenting your customers based on RFM.
We have a cheat guide that explains what you need to know about RFM segmentation.
At SeekandHit we help our clients get the most out of their marketing data. We help them optimize the data collection process, data storage, and provide analytical work products that are actionable and relevant for each of their business needs and problems. In other words, we help our clients grow.
In this article I would like to use the opportunity to share one business case that is applicable to almost every type of business that is customer oriented. We will be presenting the process, advantages, and requirements to conclude a customer segmentation project based on the variables of the RFM. These are: purchase recency, frequency, and monetary value.
RFM vs Traditional Segmentation
First things first, let’s talk about some general benefits of segmentation and why businesses do it and how. Segmentation is the concept of grouping a certain category, such as products or customers. Customer segmentation, as in our case here, is beneficial in the sense of being able to know more about customers, deliver them customized services, develop costs and revenues brackets, and create ways of communication that are relevant to their behaviors and needs.
The most common and traditional customer segmentation is based on demographics or behavioral trends. It’s important, but it’s not sufficient to deliver customized experiences. RFM is a way of segmentation based on customer purchasing behaviors. It takes into account the recency, the frequency, and the monetary value of their purchases.
The RFM based segments are more effective in delivering personalized experience because they provide another layer of differentiation between customers. This layer is created based on the analysis of historical purchase information.
Personalized experience can mean two things in this case. On one side, there is the direct way, which implies offering products or services that are more prone to be liked by a certain segment. The other way would imply using both suitable channels for each segment and appropriate acquisition costs, according to the customer value of each segment. Also, knowing who are the business champions and the loyal customers would totally change the ways of communication between such segments.
Methodology
Let’s move on to the methodology for creating customer segments based on the RFM concept.
To implement the segmentation we used a type of unsupervised machine learning technique called k-means clustering. If you are a data science practitioner, you must be familiar with k-means clustering, but if you are not, k-means clustering is a very common technique with a wide range of applications. It is powerful because it is conceptually relatively simple, scales to very large datasets, and tends to work well in practice. It is an algorithm that tries to find the best way of grouping data points into k different groups, where k is a parameter given to the algorithm.
Analysis
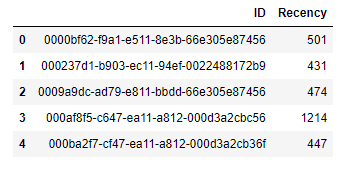
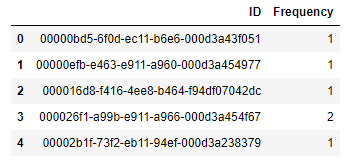
According to the table below, you can see the data frame used for the analysis. Again, we are focusing on 3 variables only. The Total_Revenue_EUR represents the monetary value of one purchase by each client ID. The recency and frequency variables must be calculated using the Arrival_Date column.
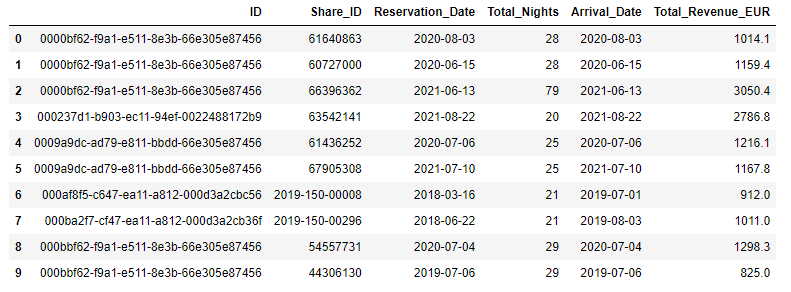
Recency is calculated in Days as the difference between each arrival_date and the soonest arrival_date found in the dataset. Meanwhile, Frequency is the unique count of arrival_date for every client ID.
The clustering algorithm was applied to 3 variables into recency, frequency, and monetary value. Taking recency as an example in the table below, you can see the summary stats for each of the given clusters.
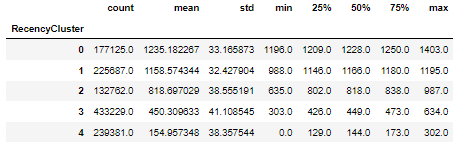
Same concept applies to the remaining variables, reaching the table below where each client ID falls into a cluster from each cluster type.
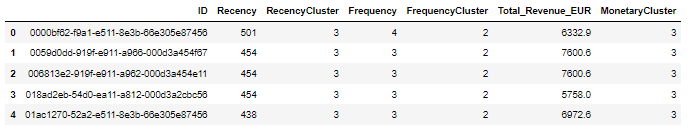
The final step in the analysis is to classify and create the segments with clear business interpretation. Segments are classified according to the min, max, and mean of each cluster for all 3 variables.
The segments are classified into four main groups. They are; Churners, Loyal Customers, New Customers, and Champions. Those four segments have a direct interpretation driven from the developed clusters above. For example, Churners segment includes customers who lay in the worst clusters, unlike Champions, which are in the best performing cluster. The remaining segments include customers who lay in the variations between the main four segments. For example, ‘Potential Loyalist’ segment includes customers who lay in clusters right behind the loyalists, while ‘At Risk’ has customers who lay just before the Potential loyalists.
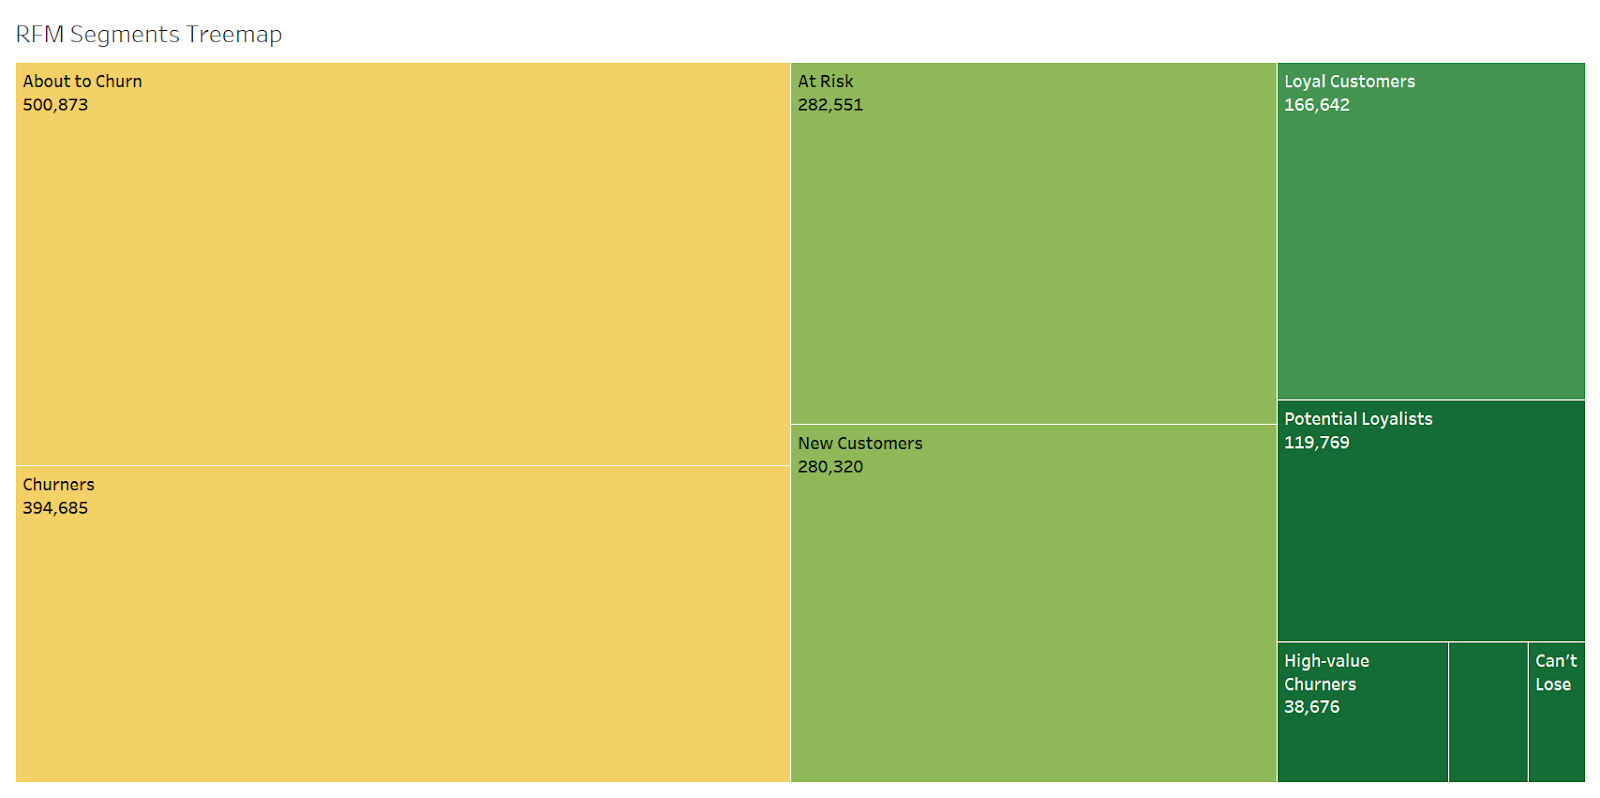
Developed Segments
About to Churn
Churners
New Customers
At Risk
Potential loyalists
Loyal Customers
High-value Churners
Champions
Can’t Lose
Interpretation
We have segmented every customer in our database. We know who the Churners are and who is about to churn or at risk. We also know our champions and loyal customers, besides our new customers.
Each segment requires a whole different way of communication. Most certainly, we cannot communicate the same message to our champions and the churners. Now we can develop marketing strategies to address each segment based on their value to the business and according to their expected behavior.
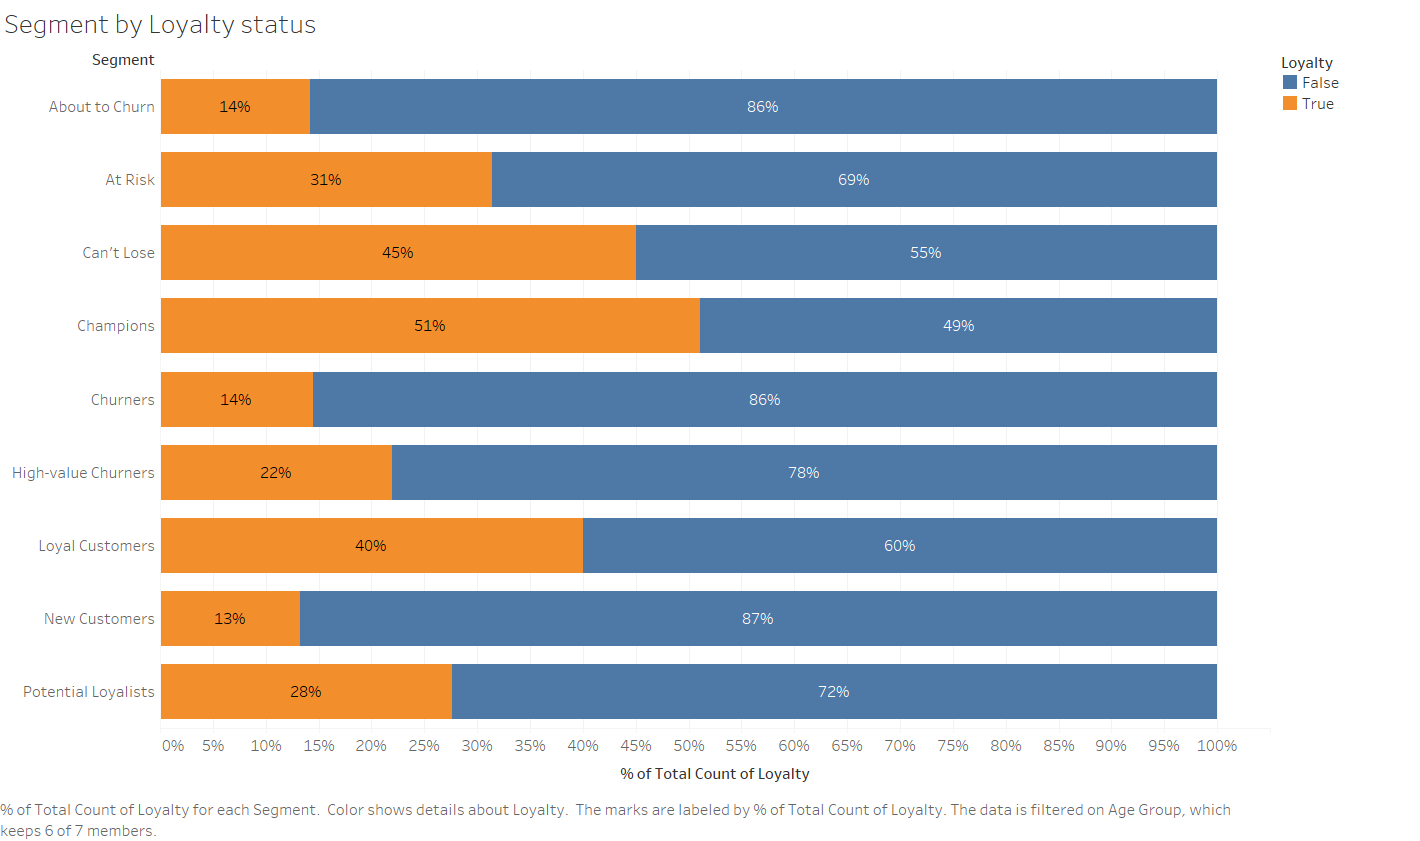
Another tip to make the most of such analysis is to uncover more information about the created segments by adding descriptive categories, such as geo-location and products data to the segments. This would allow us to create more detailed and customized strategies that involve customized communication channels, CPAs, product offerings, and messaging.
For example, below you can notice the composition of each segment by Loyalty program status, which shows that our actual loyal customers are not all on the loyalty program.
Conclusion
Traditional ways of segmentation are crucial. However, they don’t suffice for customization and personalization initiatives which most customers desire in the age of data science. The applied k-means clustering is a very common and widely used machine learning technique that is powerful and effective for segmentation purposes. As per the given case, the new information uncovered by the analytical work can drive new business and marketing strategies. It needs to get initially tested, tracked over time, repeated, and optimized.