
What should I learn to boost my Data analytics game in Marketing?
Google has some tips and tricks to uplift your processes and techniques.
With SeekandHit being one of the leading MarTech consulting agencies in the region and a Google partner, we have been invited to participate in Google’s Tech Evolution Agency Program which allowed us to take advantage of the Data Analytics Certification at Coursera.
In this article I will use the opportunity to highlight some of the key takeaways that I found remarkable in Google’s Data analytics study program, also the downsides and the things that I feel are missing from the course.
First let’s take a look at the curriculum of the course, then we can point out the key takeaways.
Course 1 – Foundations: Data, Data, Everywhere
Course 2 – Ask Questions to Make Data-Driven Decisions
Course 3 – Prepare Data for Exploration
Course 4 – Process Data from Dirty to Clean
Course 5 – Analyze Data to Answer Questions
Course 6 – Share Data Through the Art of Visualization
Course 7 – Data Analysis with R Programing
Course 8 – Google Data Analytics Capstone: Complete a Case Study
According to the chapter titles it is noticeable that the program is designed to cover the major elements of the field of data analytics, starting from the basic concept and purpose of the field, work processes and procedures, through basic tools to advanced, technical and soft skills, and finally a complete case study that sheds light on all of the learnt subjects.
Chapter by chapter overview
First things first, Chapter 1 starts with a focus on the foundation of the data analytics field. The course tackles the basics that every analyst must be aware of and able to translate them into real life situations. It starts with the concept of analytical thinking, then it moves forward by emphasizing on the data analysis process, which according to this course, consists of six steps as presented below.

If you’ve been practicing data analytics for sometime, then you are probably aware of this process and it’s very much an intuitive process that all of your work revolves around. You might have established this process through years of experience, without even thinking about it or putting it on a paper, but most definitely you can relate to every step of the process.
It’s also very important to share the main concepts of the analysis process with other stakeholders in your organization to spread more awareness around your work. By doing that you could increase the effectiveness of the collaboration with other teams in your organization as they will get at least a glimpse of your needs, as well as your outputs and potential.
On the other hand, if you are starting your analytics career, my advice is to digest this process completely and start practicing it even if you would need to create the business context yourself and basically imagine real business scenarios in order to practice the process.
If you pay attention to every step in the analytics process and the titles of the courses in the certification, you would notice that every course covers one step of the process. Some steps of the process depend on certain interpersonal and soft skills, others depend on technical skills, besides the structured work procedures that exist in each and every step of the process. In my opinion, the work procedures that Google shared in this certification is one of the most valuable additions that I personally gained from this certification. We will address some of them through the following points.
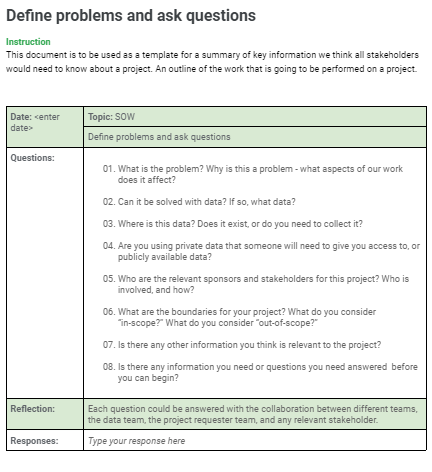
Let’s now dive into the starting point of every analytical work, starting in Chapter 2. Step number one in the analysis process is “Ask”.
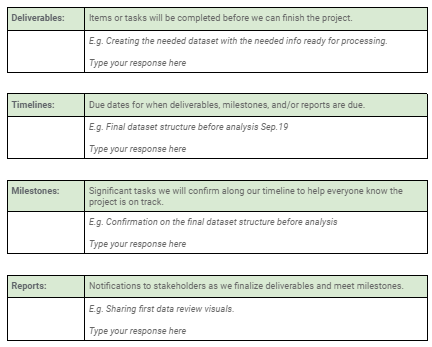
This step revolves around defining the problem that you as an analyst is trying to solve, any executed work that happens without a concrete understanding of the problem or the hypothesis between the analysts and all the stakeholders would be inefficient or ineffective. In this course’s material there are some guidelines that would help the analyst draft certain questions that would allow effective techniques to shape viable, beneficial, and actionable projects. In addition to that, another structured thinking technique is presented in this course, is the Scope of Work documentation, where business cases are defined in detail so stakeholders can be aligned on their roles, the input required from each stakeholder, besides the deliverables, timelines, milestones, and the reports of the whole project.
The core analytical work starts after the “Ask” phase, the following four chapters number 3,4,5, and 6 represent the analyst’s core work. Preparing data for exploratory analysis, Processing and cleaning data, the Analysis, and finally Sharing findings through the art of data visualization.
The chapters firstly address the types of data and ways of transforming it, data sources such as databases and cloud storage, besides the importance of metadata. Data privacy and ethics are also touched on in these chapters, besides addressing data credibility and integrity along with the common issues found in data such as biases.
After moving forward with few important theoretical concepts, the focus transforms to few crucial tools in the analytics field. Starting with spreadsheets, if you are a beginner to the field it’s a must to master some key features in spreadsheets. Through this course you will get the chance to have basic training on the tool. The material also focuses on SQL. It is a main tool that is mandatory for data extraction, cleaning and processing. The flow of the chapters allow basic SQL practice using Google BigQuery, the material provides practice on some of the most common query functions that are utilized to do common data cleaning and processing, as well as some techniques for data validation.
The SQL game doesn’t stop there, it moves to more advanced analytical functions for data manipulation and calculations that is facilitated through this course and these practices are placed under the Analysis phase of the data analysis process. Afterwards you will get to practice visual analytics on Tableau public platform as a data visualization tool. The material provides a few exercises on the tool that would give you a headstart if you have no previous experience with it. Also the material covers the core elements and concepts that every analyst needs to know about the art of data visualization. I found this part very useful, especially if your analytical experience wasn’t focused on data visualization. The material provides some techniques that are crucial for improving the ability of communicating data insights and findings to the relevant stakeholders. Generally and throughout the whole program, there are well designed hands-on exercises for all the given practical knowledge, if you adhere to the exercises you would get a real hands-on experience.
Your job as analyst ends here after the “Share” step, however, one last step remains in the data analysis process which is the “Act” step. This step is totally driven by the analyst through the previous steps but it’s up to the decision making stakeholders to take the activation actions and to Act based on the analytical work delivered and presented by the analyst.
Chapter 7 is one of the interesting chapters that focuses solely on R programming. This chapter covers the essential programming fundamentals of R through using R studio. Throughout the chapter you would learn to implement the most commonly used R packages for data cleaning, transformation, manipulation, and visualization in R.
The last chapter in this program is optional and not mandatory to earn the certification. The chapter is about a use case to practice all the learnt subjects in the other chapters. Although the chapter is optional, I recommend finishing this chapter and completing the case study, as adding a real business scenario to your learnings will have a positive impact on digesting all the learnt concepts.
Key takeaways
Finally, some general downsides that I noticed throughout the program. Though the program covers a very wide range of subjects that are all part of the analytics field, it lacks specialization in certain areas. However, It is understandable that the course is designed mainly for junior analysts, therefore the program needed to include as much information as possible from every subject of the field. On the other hand, if you already have an experience in analytics, my advice would be to find out which specific subject you are actually lacking experience or knowledge in and find a course that focuses only on that. For example, if you are lacking experience in SQL, programming, or data visualization, it would be better to enroll in one specialized course.
To summarize the key takeaways from this review, for beginners, this is a great program and would definitely be a great starting point to put you on the data analytics track. For more experienced analysts, you might find in this program some new structured ways for various analytics related procedures and techniques, that could add value and boost your organizational performance.