You are a practitioner in a digital industry, where data is a vital element to you or your organization. Most probably you or your company’s management encounter situations where you are faced with business questions that you don’t have the answers to, that’s good, you are on the right track.
Answering these questions is the way you would be able to scale your work results and conquer more challenges over time. Naturally, almost everyone is performing analytical tasks throughout his or her job. If the analytical task is relatively advanced where it may seem it will be time consuming, complicated, and where the solution may seem unclear, vague, or abstract, you might realize that you need an expert to do the job or at least give you some guidance.
In this article we will tackle the basic elements that are crucial to be addressed in the data analysis process.
Setting data objectives
Data collection
Data quality and preparation
Data analysis techniques
Setting data objective
Different types of businesses have different objectives that need to be achieved. Here are a few examples of objectives that could be accomplished through utilizing data analysis, customer segmentation, pricing strategy, building loyalty programs, or predicting customer behavior. Data can also support an objective such as a process or user experience optimization. In order to set the appropriate objective for a project, a deep dive into the business challenges is required, this phase requires a solid understanding of the business and also requires raising lots of questions around the business challenges.
Case: A client in the hotel industry came across a situation where they needed to understand the behavior of the customers in their database. The big chain needs to communicate with their clients in the most adequate manner, with the appropriate messaging and through the appropriate channel.The main challenge is about identifying when a customer becomes a churner, at which point of time after his or her last booking? And what other variables influence the purchase behavior? and how?. To summarize the objective here in this case, it is to segment the customers based on their purchase behavior, to group the customers based on their similarities.
Data collection
After setting the project’s objectives, data collection comes as the following stage. Based on the set objectives, the data must have all the necessary variables that are relevant to concluding the desired outcome. This phase includes planning and brainstorming in order to decide about the variables needed to accomplish the objective and to decide on the level of data granularity.
Case: To help our client achieve their objective of segmenting their customers, the RFM method is the suitable analytical technique for the case. RFM stands for Recency, Frequency, and Monetary. The RFM method analyzes and segments customers based on how recent and frequent their transactions are, plus the monetary value of those transactions. Therefore, the variables in the collected data must be able to describe purchases Recency, Frequency, and Monetary value.The needed data can be collected from the company’s CRM or transactional database. It is required that data collection needs to be on the most granular customer & transaction level, as It is necessary to attribute the RFM variables to each customer.

Data quality and preparation
The assessment of data pipelines and systems is vital to ensure the prevention of inaccurate data in early stages. Ensuring the quality of data pipelines is important to allow the implementation of a reliable structured framework for data collection that is customizable to various collection methods and practices. For instance, CRM systems with an ongoing data pipeline, requires a transactional and real-time data monitoring in order to continuously manage, maintain, and evaluate data quality.
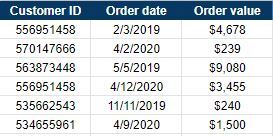
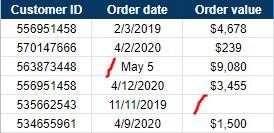
Case: Now the objective is set and the data is collected. As analysts we need to start with the data preparation, it is important to discover and understand the collected dataset, perform data cleansing to adjust the inconsistent inputs and exclude missing data, and ensure that the categorical and numerical variables are representative of the desired project. For the given example, the needed variables are presented below, Customer ID, Order date, and Order value.

Data analysis techniques
Case: After setting the data objective, collecting the relevant data, assessing the dataset quality and preparing the data for the analysis, comes the fun part, the analysis.
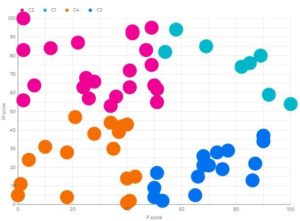
Performing the RFM analysis on the customer data can be through Excel, however, working the analysis with Excel requires a lot of manual work and calculations. Recently, more advanced technologies are implemented to conclude such insightful analysis with less time investment and more accuracy. Machine learning, and specifically, K-means clustering is a technique that will classify customers into segments based on the RFM data provided. For the given example we will use the F & M score only from RFM to segment the customers (Frequency & Monetary value). Customers segments will be ideally classified into four segments.
Ideal segment (C1) – Frequent with high value.
Potentially ideal segment (C2) – Low frequency with high value.
Loyal segment (C3) – Frequent but low value.
Churner segment (C4) – Low frequency with low value.
Various marketing techniques can be used to appropriately address each segment.

Recommendations:
Nurture the ideal segment with invitations to special events at various locations of the chain hotels.
Engage the potential segment with loyalty programs to work on increasing their purchase frequency.
Communicate with the loyal segment through costless channels and with opportunities for booking upgrades.
Combine the RFM analysis findings with demographics data to have deeper insights to the churner segment attributes.
Conclusion
In this article we shed some light on the data analysis process and the main elements and stages of the process. Using the customer segmentation example, we discussed the procedure that is common between various business situations. Deeper knowledge and practice for each stage of the procedure is required as prerequisites for the ability to conclude an efficient data analysis project.
In the next article we will take a deeper look on how data granularity can have an influence on the data analysis process and its results.


